Demo

Nedama Dairy: SCADA and MES on Ignition

A demonstration dairy plant, built on Ignition with every screen in Perspective. It shows what one system can do for a dairy, from the tanker arriving to the truck leaving.

  • Ignition Perspective
  • SCADA and MES
  • 8 plant areas

What it helps with

  • Run the plant

    Live screens for every area, in a high-performance HMI style where normal conditions stay calm and problems stand out.

  • Prove food safety

    Milk only goes forward at the set temperature and hold time, and every diversion is recorded.

  • Act on the right alarms

    Alarms that need action reach the on-call engineer by SMS through Arifa, and a reply acknowledges them.

  • Records without paperwork

    Shift, pasteurisation, CIP and batch records are produced automatically, with traceability from tanker to truck.

  • See where time, milk and energy go

    OEE, downtime reasons and energy per 1,000 litres for every shift, with no spreadsheets.

  • Know who changed what

    Users, roles and an audit trail of every change and sign-in.

The plant areas

  • Milk reception
  • Raw milk silos
  • Pasteuriser
  • Separation
  • Storage and filling
  • Yoghurt and mala
  • CIP
  • Utilities

Who it helps

  • Operators run the plant and see problems early.
  • Supervisors know how the shift is going and why lines stopped.
  • Quality answers an auditor in minutes.
  • Maintenance plans work before equipment fails.
  • Management sees cost and performance without asking for spreadsheets.

Everyone works in a web browser or on a phone, and sees only what their role allows.

The screens
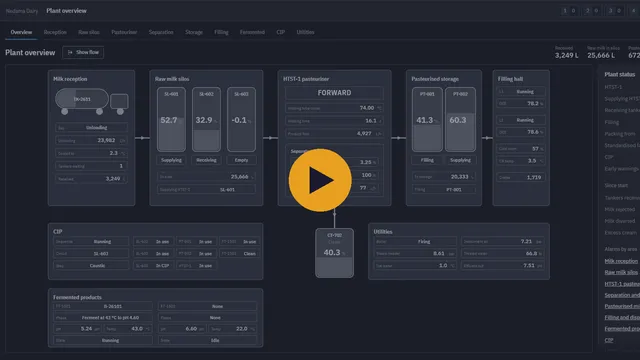
Play the Nedama Dairy walkthrough video
Watch the walkthrough
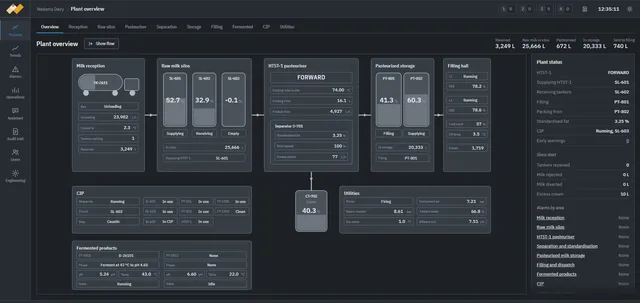
Plant overview screen of the Nedama Dairy demonstration, showing reception, raw milk silos, the pasteuriser in forward flow, storage, filling, CIP, utilities and fermented products.
The plant overview: every area on one screen, from reception to filling, with CIP, utilities and fermented products.
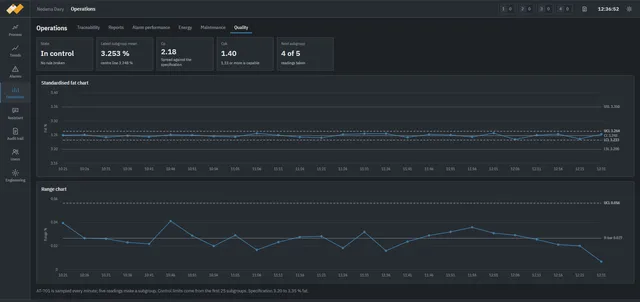
Quality screen with control charts for standardised fat, showing the process in control.
Quality: standardised fat is tracked on control charts, so a drift shows before product goes out of specification.
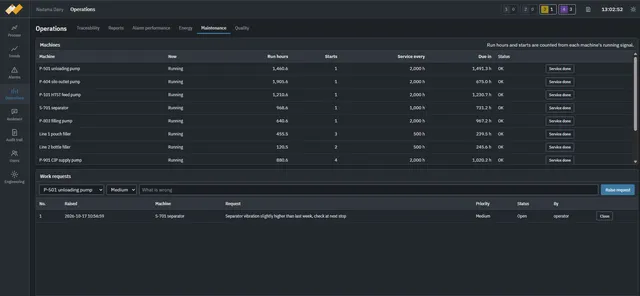
Maintenance screen listing machines with their run hours, starts, service interval and hours until the next service, and an open work request for the separator.
Maintenance: run hours and starts counted for every machine, the next service shown in time, and work requests raised from the same screen.
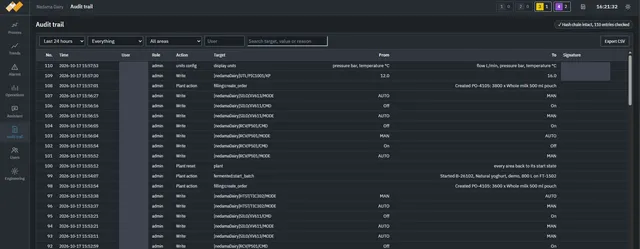
Audit trail screen listing recent changes with time, role, action, target, and old and new values, with user names hidden, and a note that the hash chain is intact.
Audit trail: every change, who made it and when, with old and new values, and a check that no entry has been altered.

This is a demonstration on simulated equipment, not a client project. On a real project, the same screens connect to the plant's own PLCs and instruments. Want to see it on your own plant? Talk to us.